Choosing the best robot automation in 2026 starts with a clear view of the work, not the newest product launch. A robot that moves parts between two fixtures may need speed, repeatability, and a small footprint. A system that handles mixed orders may need flexible grippers, machine vision, and straightforward changeovers. Define the task, expected volume, cycle time, and acceptable error rate before comparing vendors. Be specific. “Improve productivity” is not a useful acceptance test; “complete 240 cycles per hour across three part types” is much easier to evaluate.
Then examine the whole system. Ask how the robot will connect to existing machines, software, and safety controls. Request a live demonstration using your own parts, and measure performance under realistic conditions. Check programming requirements, service response times, spare-part availability, and the skills your team will need. Pay attention to the operator’s view of the cell, too: a confusing interface or awkward maintenance access can turn a promising installation into daily frustration. Small details matter.
Cost deserves a closer look than the purchase price. Include integration, tooling, training, downtime, and ongoing maintenance in the comparison. Ask vendors to explain their assumptions, and verify claims with references from similar applications. A pilot can reveal issues that a polished demo will not. Still, no checklist can remove every uncertainty. Forecasts change, and production floors are rarely perfect. The strongest choice is not always the most advanced robot; it is the solution your team can run, maintain, and improve reliably.
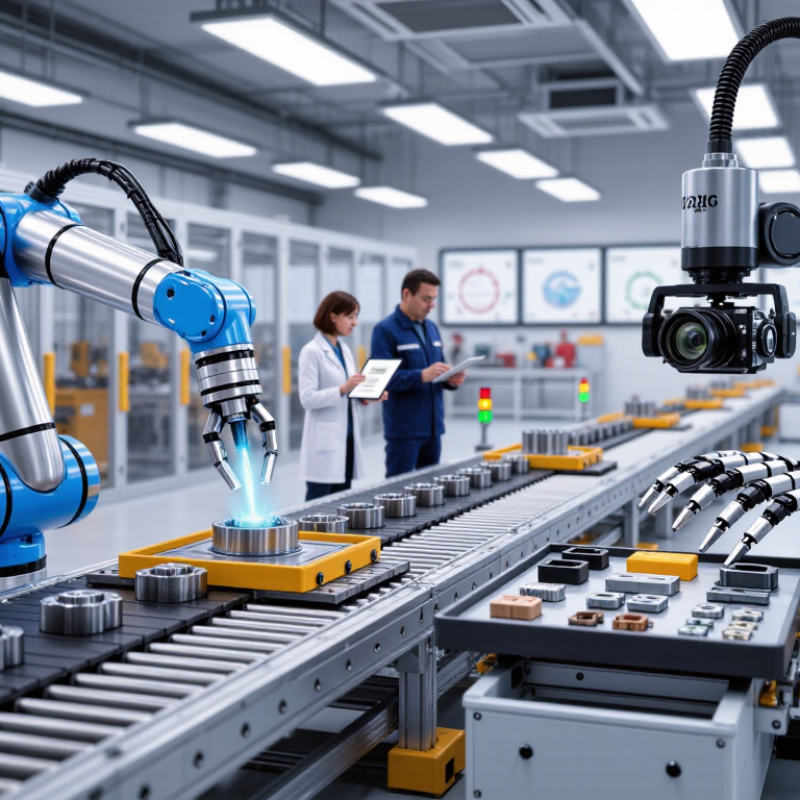
Robot automation describes machines that sense, decide, and act with limited human input. Industrial robots handle repeatable tasks such as welding, palletizing, and machine tending. Collaborative robots are designed to work near people, though safe operation still depends on task-specific risk assessment. Mobile robots move materials through warehouses and factories; some follow fixed routes, while others navigate changing spaces. Service robots support work outside traditional production lines, including logistics, inspection, and healthcare. The categories overlap. That can confuse buyers.
The International Federation of Robotics reported 4,281,585 industrial robots operating worldwide in 2023, in its World Robotics 2024 report. Its service-robot report recorded nearly 205,000 professional service robots sold that year, with transport and logistics leading demand. These figures show scale, not suitability. A busy warehouse may benefit from mobile robots, while a small workshop might gain more from a fixed-arm system. Measure cycle time, payload, floor space, safety needs, and integration effort before comparing types. Look closely at the dull details. A robot that fits the task poorly can add complexity rather than remove it. I would not treat these categories as clean boxes; real facilities often need a mix, and projections cannot tell you how well a system will fit your workflow.

Choosing robot automation in 2026 starts with the work, not the machine. Track a typical shift: cycle times, changeovers, stalled tasks, and the minutes workers spend reaching, lifting, or checking parts. Note where product variety disrupts routines. A robot that excels on one steady task may struggle when batches change every hour. Start small.
Set measurable goals before comparing systems. Define the required output per shift, acceptable error rate, available floor space, and how often people must intervene. Include integration time and staff training in the budget; these are easy to underestimate. IFR’s World Robotics 2024 report recorded 541,302 industrial robot installations worldwide in 2023, with 4.28 million operating in factories. These figures show adoption at scale, not that every task needs a robot.
The World Economic Forum’s Future of Jobs Report 2025 found that 58% of surveyed employers expect robotics and autonomous systems to transform their business by 2030. Treat that forecast as a prompt to assess your own bottlenecks, not a purchase target. Ask operators to test proposed workflows using real parts and normal shift conditions. I’d challenge one assumption: faster cycles do not always mean better results. A pilot can reveal awkward handoffs, missed checks, or maintenance needs that a spreadsheet overlooks.
How to Choose the Best Robot Automation in 2026?
Comparing Robot Capabilities, Flexibility, and Compatibility
A capable robot should match the task, not just a specification sheet. Check payload, reach, repeatability, and cycle time against real workpiece dimensions. A gripper carrying a 4-kilogram part may need extra capacity for its tooling. Run representative tasks, including awkward picks and brief pauses. Small details matter. Record results across several shifts, since a smooth demonstration may not reflect daily variation.
Flexibility matters when product sizes or workflows change. Look for adjustable programs, accessible controls, and changeovers that operators can complete without specialist support. Compatibility deserves equal attention. Confirm the robot can communicate with existing controllers, sensors, end effectors, and production software. Test the full cell, not only the arm. A connection that works on paper can still create delays at a handoff. No scorecard captures every awkward moment; allow time for a realistic trial, and revise assumptions when results differ.
Tips: Map one common task and one difficult task before comparing systems. Measure changeover time, integration effort, and operator training needs. Ask who will maintain the setup. Test it unloaded, then with actual parts.
Global industrial robot installations provide context for automation demand. Compare each candidate’s payload, reach, repeatability, safety features, and compatibility with your tools and control systems.
Annual installations, thousands of units. Source: International Federation of Robotics (IFR), World Robotics reports; values rounded.
Evaluating Safety, Integration, and Total Cost of Ownership
Start with the actual task, not the robot’s headline specifications. Record the workpiece weight, reach, cycle time, and how people enter the work area. Walk the proposed cell. Look for pinch points near fixtures and awkward access during changeovers. Small details matter. Check that safeguarding fits the real workflow, then test the system at expected operating speeds. A specification sheet cannot reveal every floor-level hazard.
Integration deserves equal scrutiny. Confirm how the robot will communicate with existing controls, sensors, and production software. Test a representative workpiece, including variations that occur on busy shifts. What happens when a sensor misses a part? Can a technician recover the cell without waiting for specialist support? It gets messy. Training, clear fault messages, and accessible maintenance points can reduce delays, but they need practical testing.
Total cost of ownership includes more than the purchase price. Include tooling, cell modifications, programming, installation, energy, maintenance, spare parts, and planned downtime. Estimate savings using realistic utilization, not a perfect shift that never happens. Compare those costs with measured cycle times and current labor needs. Early forecasts are often optimistic; a pilot can expose that. Keep the assumptions visible, especially when product mix or staffing changes frequently.
Choosing robot automation in 2026 should start with a measured trial, not a feature list. Map one repeatable task, such as moving a 4-kilogram part between a tray and a fixture. Record the current cycle time, defect rate, and minutes spent on changeovers. Set acceptable targets before testing. Otherwise, impressive results can shift the goalposts.
Run the trial with real materials, operators, and representative work shifts. Include setup, routine operation, and recovery from a stopped cycle. Watch closely. Note how often staff intervene, how long restart takes, and whether parts arrive in consistent positions. A polished demonstration can mislead: a scorecard may reward speed while overlooking awkward recovery steps. That is easy to miss.
Compare results with the baseline, then check practical fit. Confirm the robot’s reach and payload suit the task, and ask how maintenance access affects downtime. Estimate the full cost, including tooling, integration, training, and replacement parts. Not just purchase price. Keep raw measurements and record assumptions; a short trial cannot predict every production issue. If results vary by shift or operator, investigate the cause before selecting a solution. A spreadsheet may look precise while hiding shaky data.
| Evaluation Dimension | Weight | What to Test | Evidence to Collect | Example Acceptance Rule | Score (1–5) |
|---|---|---|---|---|---|
| Task and process fit | 20% | Run representative production tasks, including normal variation, changeovers, and recovery from common errors. | Task completion rate, exception frequency, required operator interventions, and observed process limitations. | Completes the agreed task sequence and handles defined product and process variations. | — |
| Cycle time and throughput | 15% | Measure sustained performance over repeated production cycles, including loading, unloading, and handoffs. | Median and high-percentile cycle time, completed units per hour, and bottleneck observations. | Meets the production takt time under representative operating conditions. | — |
| Payload, reach, and workspace | 10% | Test the heaviest and most awkward expected workpieces across all required positions and orientations. | Payload configuration, reach envelope, clearance checks, fixture needs, and access to the work area. | Handles the defined workpiece range without exceeding the proposed system’s rated limits. | — |
| Accuracy and repeatability | 10% | Repeat placement, inspection, or processing tasks across representative parts and operating conditions. | Measured position or process variation, defect results, calibration requirements, and sensitivity to part variation. | Stays within the process tolerance agreed for the application. | — |
| Safety and risk controls | 15% | Review the complete cell, including tooling, access points, safeguarding, foreseeable misuse, and recovery procedures. | Documented risk assessment, safeguarding design, stop and restart tests, and operator training requirements. | Risks are assessed and reduced using applicable workplace rules and relevant safety standards. | — |
| Integration and changeover | 10% | Test connections to required equipment and systems, then run a product changeover with production staff. | Interface test results, data exchanged, changeover time, configuration steps, and fault recovery procedure. | Required interfaces work, and the changeover process meets the site’s operational needs. | — |
| Reliability and maintainability | 10% | Run an extended trial and simulate routine maintenance and recovery from likely faults. | Unplanned stops, recovery time, maintenance tasks, spare-part needs, and service-response arrangements. | Trial results and support arrangements meet the site’s agreed availability and maintenance targets. | — |
| Total cost of ownership | 10% | Compare the full expected cost over the planned evaluation period, not just the purchase price. | Installation, integration, tooling, training, energy, maintenance, consumables, and end-of-life costs. | The documented cost model fits the approved budget and business-case assumptions. | — |
| Total | 100% | Weighted score = sum of (criterion score ÷ 5 × criterion weight). Score each criterion from 1 (does not meet requirements) to 5 (fully meets requirements). | — / 100 | ||
Selection note: The weights are an example screening model, not universal benchmarks. Set application-specific targets before testing, use representative parts and operating conditions, and compare solutions using the same test plan.