Industrial automation is no longer just about robots behind safety fences. It connects sensors, programmable controllers, drives, software, and people across busy production floors. A small control fault can stop a packaging line; a well-integrated system can help operators spot problems sooner. The right supplier matters.
Taiichi Ohno, a leading figure in the Toyota Production System, said, “Where there is no standard, there can be no kaizen.” That idea remains useful when comparing automation providers. Standards, compatible equipment, clear documentation, and responsive technical support can shape a project long after installation. Details matter.
This guide examines major industrial automation suppliers, including Siemens, Rockwell Automation, ABB, Schneider Electric, Mitsubishi Electric, Honeywell, and Emerson. It considers their product breadth, industry experience, integration options, and service presence—not just brand recognition. A supplier’s strengths can vary by region, facility size, and application. No shortlist is perfect. Some companies excel in process control; others have deeper experience with discrete manufacturing or motion systems. Buyers should verify current product availability, support coverage, and system compatibility for their own sites. A polished brochure cannot reveal every commissioning challenge. The comparison that follows is a starting point, not a substitute for engineering review.
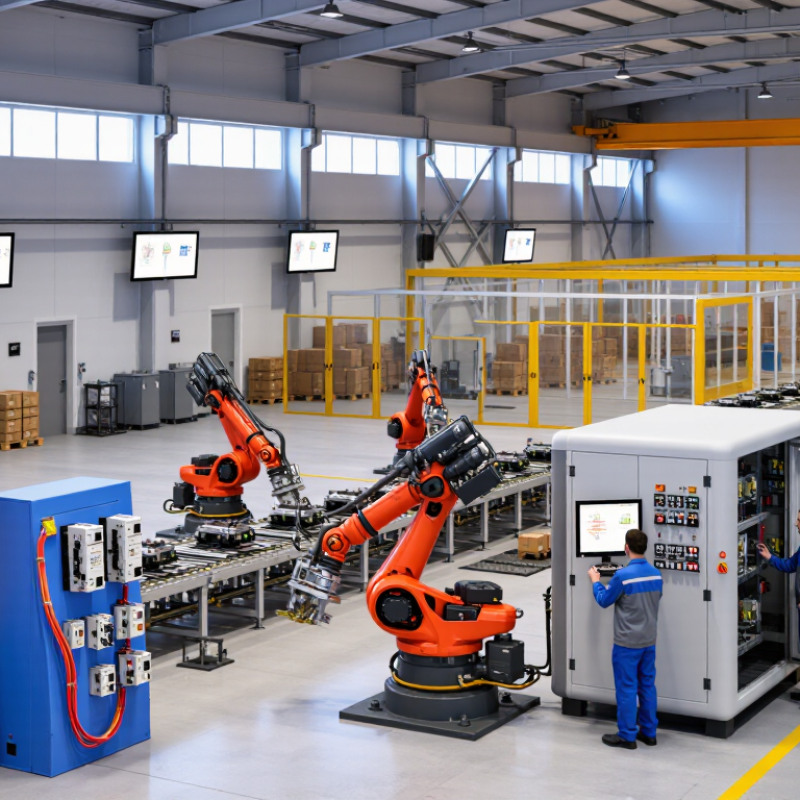
Industrial automation suppliers are best compared by the work their systems perform, not by product labels. Control systems coordinate sensors, drives, and safety interlocks across a production line. Robotics handles repeatable tasks such as palletizing, welding, or moving components between stations. Software connects these layers through monitoring, production scheduling, and maintenance tools. The International Federation of Robotics reported 541,302 industrial robot installations worldwide in 2023, with the operating stock reaching 4.28 million. That scale makes integration—not a robot’s headline speed—a practical measure of supplier capability.
The World Economic Forum’s 2023 Global Lighthouse Network report counted 132 advanced manufacturing sites, reflecting growing use of connected production technologies. For buyers, useful questions are concrete:
Can operators see a fault on a clear dashboard?
Can a technician trace a stoppage to a sensor, program, or network issue?
Does the software exchange data with existing equipment?
Integration is the test. Still, supplier comparisons can mislead when they focus on feature lists rather than commissioning effort, training, and support after installation. A system may look elegant in a demonstration and feel cumbersome on a noisy factory floor. That gap deserves scrutiny.
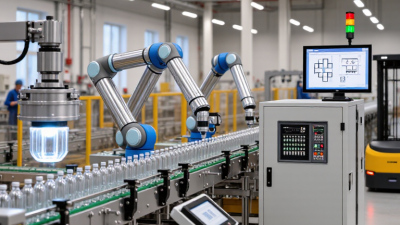
IFR’s World Robotics 2024 report recorded 541,302 industrial robot installations worldwide in 2023. That was the second-highest annual total on record, about 2% below 2022. The global operating stock reached roughly 4.28 million units, rising 10% from the previous year. That is substantial. Asia accounted for about 70% of new installations, while Europe represented 17% and the Americas 10%, according to IFR. These figures show a large, geographically concentrated market, but they do not reveal which suppliers captured the most orders.
For manufacturers, the scale becomes tangible on a factory floor: robot arms handling hot components, tending machines, or moving cartons along a line. Yet installation totals measure deployed units, not supplier quality, revenue, or customer satisfaction. A plant comparing suppliers still needs to examine cycle time, integration support, safety performance, and maintenance access. The headline number can mislead. Installations may reflect purchasing decisions made months earlier, and demand varies sharply by industry and region. IFR’s figures are a useful market baseline, not a complete ranking of supplier strength. That distinction matters when a large global total is used to guide a local investment decision.
Annual industrial robot installations worldwide show the scale and momentum of the automation market. Installations reached 541,302 in 2023, the second-highest annual total on record.
Source: International Federation of Robotics (IFR), World Robotics reports. Earlier annual figures are rounded.
Industrial automation suppliers are judged by more than product catalogs. The strongest control suppliers usually combine PLCs, industrial networks, safety systems, motion control, and cloud connectivity. Three global leaders stand out through different strengths. One is known for broad engineering integration and strong factory software. Another offers practical control platforms, familiar programming tools, and extensive North American support. The third emphasizes energy management, electrical distribution, and scalable automation for buildings and process plants.
In real projects, supplier selection depends on the production environment. A packaging line may need fast motion control and simple diagnostics. A chemical facility may prioritize redundancy, secure communications, and long-term service. During commissioning, clear documentation matters as much as hardware. I have seen reliable equipment lose value when technicians could not find replacement parts quickly. No supplier is perfect. Compatibility claims also deserve testing under actual network loads.
Tips: Compare the complete lifecycle cost, not only the initial quotation. Request a live demonstration using your sensors, drives, and network architecture. Check local training, spare-part availability, cybersecurity updates, and response times. Ask for references from facilities with similar operating conditions. A small pilot can expose integration problems early. Measure recovery time after a simulated fault. That evidence is often more useful than polished sales presentations.
Major robotics suppliers differ less by the word “robot” than by the work their systems handle well. One may be known for compact arms that fit beside assembly workers; another for high-speed machines on automotive lines. Others offer broad robot families, motion controls, and factory software. Their equipment can support welding, painting, material handling, and precise assembly. The right fit depends on payload, reach, cycle time, and the space available. Small details matter. A robot that clears a fixture by only a few centimeters may complicate maintenance.
Compare suppliers using the same test pieces and production targets. Check repeatability, programming effort, spare-parts access, and local service response. Ask who will integrate safety equipment, grippers, and vision systems. A fast arm is not automatically a productive cell. The surrounding process can become the bottleneck. Request a realistic demonstration, including changeovers and recovery from common faults. Also review training needs; a system that only one technician can troubleshoot creates risk. No shortlist is perfect. Supplier claims deserve verification, and even a well-matched robot may need adjustments after installation. Those trade-offs are worth discussing before purchase.
Industrial automation suppliers should be compared at the machine boundary, not by feature lists. Ask how controllers, drives, sensors, and production software exchange data. Request a test with your actual tags and alarm states. Can the supplier document protocol limits, data ownership, and recovery after a network interruption? That detail matters. A polished demo cannot prove reliable integration on a busy production line. For safety, review hazard assessments, safety-function response times, validation records, and responsibility for later modifications. A certificate alone is not a site-specific review.
Support is measurable. Compare response windows, local technical coverage, spare-part lead times, training, and software update periods. Then calculate lifecycle cost: commissioning, downtime, energy, licensing, upgrades, and migration—not just purchase price. The International Energy Agency’s Energy Efficiency 2023 report puts industry at about 37% of global energy use, making efficiency claims worth checking against measured operating data. The U.S. Department of Energy estimates motor-driven systems account for 54% of electricity use in U.S. manufacturing. Control and drive choices can affect recurring costs. Still, projected savings may not hold across different shifts, loads, or maintenance habits. Treat estimates as hypotheses. A scorecard can also create false precision: low price and fast support do not always translate into a meaningful single score.
| Evaluation Area | Suggested Weight | What to Compare | Evidence to Request | Scoring Guide (1–5) |
|---|---|---|---|---|
| Integration and interoperability | 20% | Compatibility with the plant’s existing PLCs, drives, robots, sensors, and supervisory systems. Check support for the protocols actually required by the project, such as OPC UA, PROFINET, EtherNet/IP, or Modbus TCP. | Protocol and device compatibility matrix; interface documentation; sample configuration; results from a proof-of-concept using representative equipment. | 1 = Major custom interfaces required; 3 = Most required devices connect with some engineering; 5 = Required interfaces are documented and demonstrated with minimal custom work. |
| Functional safety | 20% | Ability to support the machine’s risk assessment and required safety functions, including appropriate safety controllers, drives, and documented engineering processes. Relevant standards can include IEC 61508, IEC 62061, and ISO 13849-1, as applicable to the system and jurisdiction. | Safety manuals and certificates for applicable products; safety-function data; validation documentation; examples of risk-assessment and commissioning support. Confirm the scope of any certificate rather than treating it as approval of an entire installation. | 1 = Required safety evidence or functions are missing; 3 = Requirements are met with additional integration or validation effort; 5 = Applicable evidence, functions, and validation support are clearly documented. |
| Technical support and service | 15% | Availability of application engineering, commissioning help, troubleshooting, training, and escalation coverage during the plant’s operating hours and in its location. | Written support hours and response targets; escalation path; service coverage map; training plan; references for comparable installations. | 1 = Limited or unclear support; 3 = Defined support with some coverage gaps; 5 = Documented coverage and escalation arrangements align with site needs. |
| Lifecycle cost | 25% | Compare total cost over the same analysis period, not just purchase price. Include hardware, software and subscription fees, engineering, integration, training, spares, maintenance, upgrades, downtime, and expected replacement costs. | Itemized quotation; license and renewal terms; maintenance and upgrade costs; recommended spare-parts list; stated assumptions for downtime and service life. | 1 = Significant costs or assumptions are undisclosed; 3 = Main cost categories are estimated but some remain uncertain; 5 = Comparable, itemized lifecycle costs and assumptions are provided. |
| Cybersecurity and updates | 10% | Security controls for products and remote access, vulnerability handling, software update practices, and compatibility with the site’s network segmentation and access policies. | Security documentation; vulnerability reporting process; update and support policy; remote-access controls; applicable product security certifications or test reports. | 1 = Security practices are unclear; 3 = Core controls and update processes are documented; 5 = Documentation, vulnerability handling, and update procedures meet defined site requirements. |
| Scalability and maintainability | 10% | Ease of expanding the system, reusing standards and configurations, finding trained personnel, and maintaining equipment over the planned service life. | Expansion architecture; configuration and backup procedures; training materials; product lifecycle notices; parts availability and migration plans. | 1 = Expansion or maintenance depends on substantial redesign; 3 = Expansion is feasible with additional engineering; 5 = Documented, supportable expansion and maintenance paths are available. |
How to use the matrix: Score each shortlisted supplier from 1 to 5 using the evidence above, then calculate the weighted result as the sum of (score ÷ 5 × suggested weight). The weights are a starting point, not a universal ranking; adjust them to the project’s risk, operating conditions, and procurement priorities. This framework compares suppliers without making unsupported performance claims about any specific company.